Data Fluency
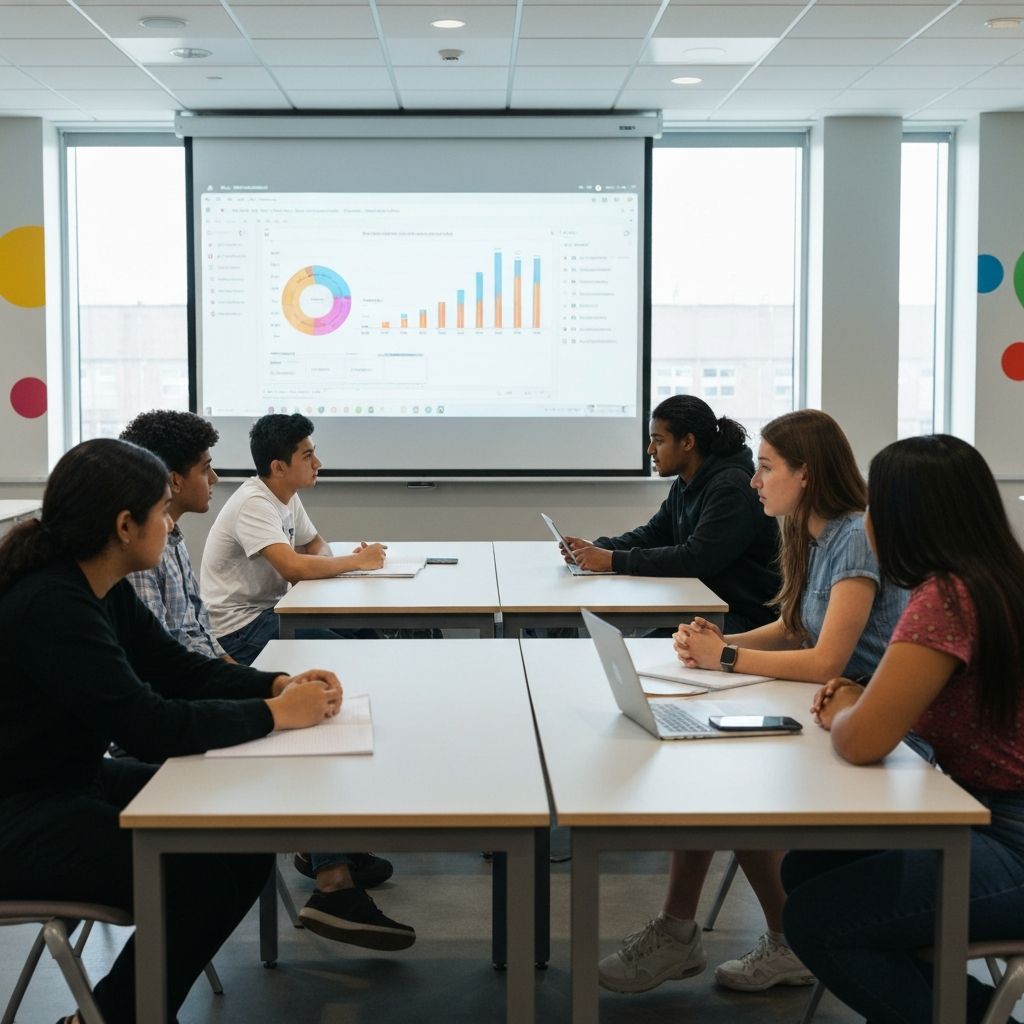
Students learn to read, interpret, and create data visualizations using local datasets. From census data to environmental metrics, they build statistical literacy through analysis that matters.
Learn moreThree core programs designed to build applied STEM skills through hands-on, community-connected learning.
Students learn to read, interpret, and create data visualizations using local datasets. From census data to environmental metrics, they build statistical literacy through analysis that matters.
Learn moreScientific communication through infographics, diagrams, and visual explanations. Students translate complex research into clear, accessible formats for diverse audiences.
Learn moreMathematics in context: budgeting, measurement, spatial reasoning, and modeling. Every concept connects to real problems students can identify and solve in their own neighborhoods.
Learn moreTangible learning through assembly, wiring, debugging, and systems thinking. Students build real skills with real tools.
Build and program robots that sense and respond. Motor control, sensors, and iterative debugging.
Explore pathwayFlight physics, safety protocols, and control systems. Responsible operation from day one.
Explore pathwayArduino, sensors, and telemetry. Bridge kits that connect builds to real-world applications.
Explore pathwayWe track what matters: skill development, engagement, and real-world application.
STEMographics partners with educators, schools, and community organizations to deliver programming where it's needed most.
Standards-aligned curriculum modules that integrate with existing math and science instruction. Professional development for teachers included.
Flexible after-school and summer programming that brings applied STEM learning to libraries, community centers, and youth programs.
Professional development workshops and resources for teachers looking to bring data literacy and visual learning into their classrooms.